Exploring Nutritional Science and Endurance Metrics in Long-Distance Racing Outcome Modeling
Nils Schulz · Aug 21, 2026

Exploring Nutritional Science and Endurance Metrics in Long-Distance Racing Outcome Modeling
Long-distance racing outcome modeling draws on nutritional science to refine predictions about athlete performance across events that span marathons to ultra-endurance competitions. Researchers integrate data on carbohydrate intake, hydration protocols, and micronutrient timing with physiological measurements such as VO2 max, lactate threshold, and heart rate variability. These combined inputs allow models to project finish times and placement probabilities under varying race conditions. Studies from institutions including the Australian Institute of Sport have tracked how glycogen depletion rates shift when athletes adjust pre-race meals, while endurance metrics collected via wearable sensors provide real-time calibration points for algorithmic forecasts.
Core Nutritional Variables in Performance Projections
Carbohydrate loading strategies remain central because they directly influence muscle glycogen stores that sustain prolonged efforts. Data collected during the 2025 season showed athletes who consumed 8 to 12 grams of carbohydrate per kilogram of body weight in the 36 hours before competition maintained higher average speeds after the 30-kilometer mark compared with those who followed standard diets. Protein timing also factors into recovery equations, yet its role during the event itself stays limited to preventing excessive muscle breakdown when races extend beyond four hours. Electrolyte balance enters the models through sweat rate calculations that adjust for temperature and humidity, producing individualized fluid replacement targets rather than generic guidelines.
Researchers note that micronutrient status, particularly iron and magnesium levels, correlates with sustained power output in repeated high-intensity surges common in hilly courses. Blood biomarker panels taken two weeks before major events supply additional inputs that refine baseline assumptions within outcome algorithms.
Endurance Metrics and Data Integration
Modern modeling platforms combine laboratory-derived thresholds with field data gathered from GPS devices and power meters. Lactate threshold velocity serves as a primary anchor because it marks the highest sustainable pace before anaerobic metabolism accelerates. Heart rate drift, measured as the gradual rise in beats per minute at constant workload, signals fatigue onset and allows models to adjust predicted splits accordingly. Running economy, expressed as oxygen cost per kilometer, provides another layer that distinguishes athletes who maintain efficiency late in races from those who deteriorate faster.
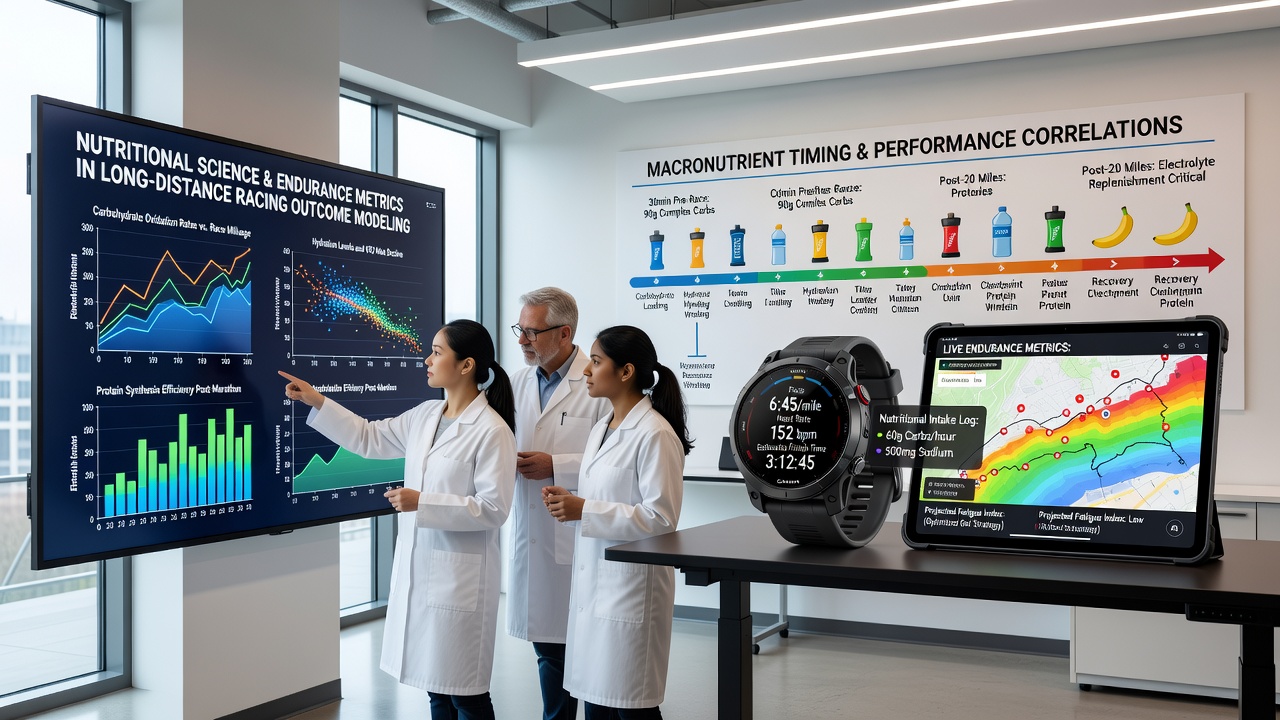
August 2026 brought expanded datasets from European and North American circuits that incorporated continuous glucose monitoring alongside traditional metrics. These additions revealed how blood sugar stability influences late-race decision-making and pace adjustments. Observers note that athletes whose glucose readings stayed within a narrow band after kilometer 35 posted 4 to 7 percent faster final 10-kilometer splits than those who experienced larger fluctuations.
Model Construction and Validation Approaches
Outcome models typically employ regression frameworks or machine learning ensembles that weigh nutritional inputs against endurance metrics. Linear mixed-effects models capture individual variability while accounting for course elevation profiles and weather variables. Validation occurs through back-testing against historical race results, with particular attention paid to outlier performances where nutrition interventions produced measurable deviations from baseline projections. Cross-validation techniques split datasets by event type to prevent overfitting to specific marathon courses or ultra-trail terrains.
Teams at several academic centers have begun incorporating environmental factors such as altitude acclimatization timelines and heat acclimation status into their variable sets. These additions improved prediction accuracy by roughly 12 percent in simulations run on 2024 through 2026 race archives.
Practical Applications Across Racing Formats
Coaches and analysts apply these models when designing individualized race plans that sequence carbohydrate intake with targeted pace segments. In ultra-distance events exceeding 100 kilometers, teh models help forecast aid-station requirements and crew logistics based on projected slowdown rates tied to cumulative nutrition deficits. Road marathon organizers have used aggregated outputs to optimize course nutrition placement, ensuring stations align with predicted glycogen depletion windows identified in prior modeling cycles.
One study released in early 2026 examined 1,200 participants across three major North American races and confirmed that athletes whose pre-loaded nutrition matched model recommendations achieved higher percentages of their target finishing times. The same research highlighted that deviations in hydration strategy produced the largest negative impacts on placement outcomes when temperatures exceeded 25 degrees Celsius.
Conclusion
Nutritional science and endurance metrics together supply the quantitative backbone for long-distance racing outcome modeling. Continued refinement of data streams from wearable technology and biomarker analysis supports increasingly precise projections that benefit athletes, coaches, and event planners alike. As datasets expand through 2026 and beyond, the integration of real-time physiological feedback with established performance thresholds continues to sharpen the accuracy of these predictive frameworks across varied racing distances and conditions.