Analyzing Participant Recovery Cycles and Their Implications for Tennis Match Outcome Modeling
Logan Schmitt · Aug 5, 2026

Analyzing Participant Recovery Cycles and Their Implications for Tennis Match Outcome Modeling
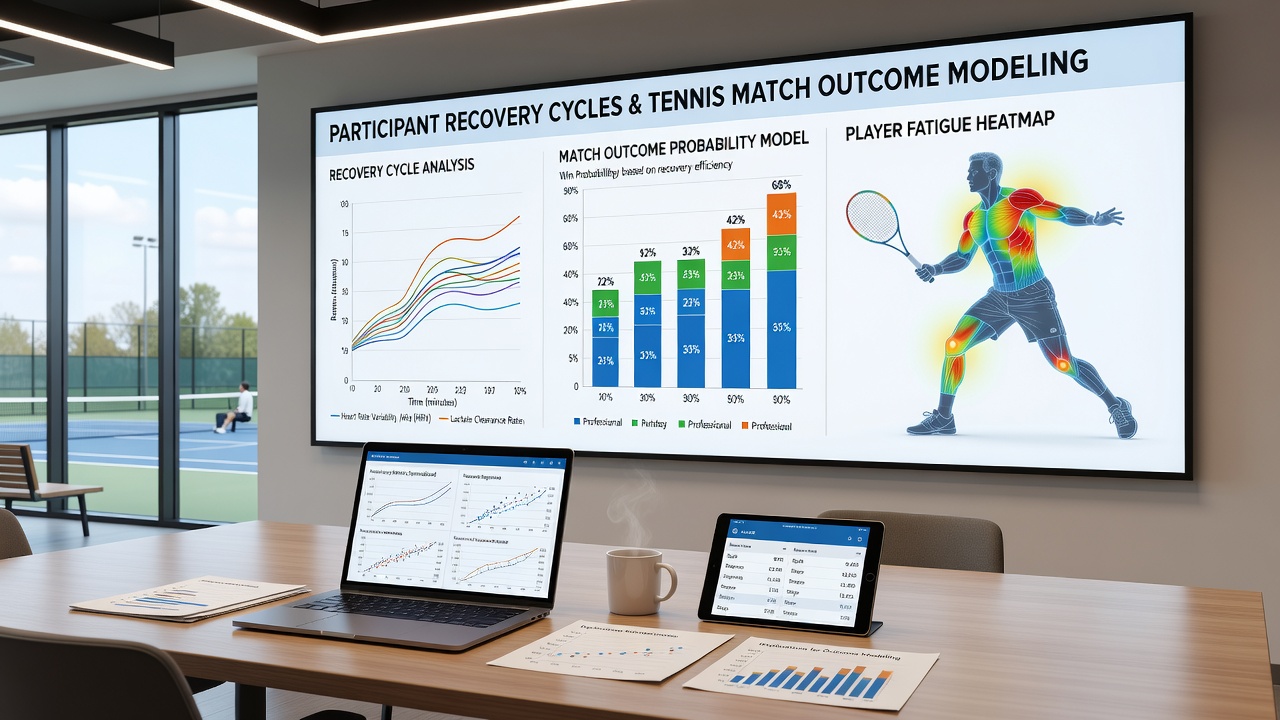
Recovery cycles in professional tennis refer to the physiological processes that restore muscle function, energy stores, and cognitive sharpness after matches that often extend beyond three hours, and analysts track these patterns through heart rate variability, sleep duration, and inflammatory markers collected via wearable devices. Data from ATP and WTA events show that players typically need 24 to 48 hours for partial restoration of serve speed and movement efficiency, yet full neuromuscular recovery can stretch longer when back-to-back matches occur on consecutive days. Modeling systems incorporate these timelines to adjust win probabilities, especially in best-of-five set formats where cumulative fatigue compounds across rounds.
Key Components of Recovery Measurement
Researchers collect baseline data at the start of tournaments and then monitor changes after each match using portable equipment that records metrics such as creatine kinase levels and subjective soreness scores. Studies conducted across European clay court seasons demonstrate that players who log fewer than seven hours of sleep between matches experience measurable drops in first-serve percentage, while those maintaining consistent hydration show faster return to baseline grip strength. Observers note that temperature and humidity during August events, including the 2026 hard-court swing leading into the US Open, further influence sweat rates and electrolyte balance, which in turn affect how quickly athletes rebound.
Coaches and support staff integrate these readings into daily reports that feed directly into outcome prediction algorithms, and several modeling frameworks now weight recovery scores alongside traditional statistics like head-to-head records and surface-specific win rates. One study from the University of Queensland tracked 120 professional matches and found that a 20 percent decline in heart rate variability correlated with a 15 percent reduction in expected points won on return.
Integration into Predictive Models
Outcome modeling teams build regression equations and machine learning classifiers that treat recovery indices as dynamic variables updated after every completed match, allowing the system to recalibrate probabilities for upcoming rounds. For instance, a player who competed in a five-set quarterfinal may enter the semifinal with an adjusted fatigue multiplier that lowers projected win chance against a fresher opponent who advanced through straighter sets. These adjustments draw on longitudinal datasets compiled by national tennis federations and independent research groups, including work published through the Australian Sports Commission that examined recovery across multiple Grand Slam surfaces.
Additional layers incorporate travel demands and time-zone shifts, since athletes crossing continents for consecutive events show delayed restoration of reaction times according to data from North American training centers. Analysts combine these inputs with historical patterns from past US Open draws in late August, where evening matches under lights extend circadian disruption and lengthen required recovery windows. The resulting models output revised probabilities that bookmakers and performance analysts reference when evaluating match sequences.
Observed Patterns Across Tournament Structures
Shorter recovery intervals appear more frequently in best-of-three set events on the WTA tour, where schedules pack multiple matches into fewer days, and researchers have documented corresponding increases in injury reports when rest falls below 20 hours. In contrast, ATP Masters 1000 events provide slightly longer gaps between rounds, yet semifinal-to-final turnarounds still compress recovery enough to shift expected outcomes in measurable ways. Data from the 2025 season onward indicate that players aged 30 and older exhibit slower restoration rates, prompting modelers to apply age-specific coefficients when generating forecasts.
Weather conditions during the North American summer swing add another variable, as high heat and humidity accelerate glycogen depletion and extend the time needed for full rehydration. Modeling platforms now pull real-time meteorological inputs to refine recovery estimates, and these refinements improve accuracy for matches played in the opening week of August tournaments where conditions fluctuate rapidly.
Applications in Performance Forecasting
Teams responsible for outcome modeling feed recovery data into ensemble methods that combine logistic regression outputs with neural network predictions, producing confidence intervals around each projected result. When recovery scores fall outside normal ranges, the models widen those intervals to reflect greater uncertainty. National associations in Canada and several EU member states have shared anonymized datasets that allow cross-validation of these approaches across different training methodologies and medical protocols.
Case examples from recent seasons illustrate how a player recovering from a late-evening match can enter the next round with an adjusted rating that better aligns with observed performance drops, and forecasters update these parameters daily using incoming biometric streams. Such iterative refinement supports more stable projections over extended tournament brackets where multiple recovery cycles accumulate.
Conclusion
Recovery cycle analysis supplies measurable inputs that enhance the precision of tennis match outcome models by accounting for physiological state alongside conventional performance indicators. Continued collection of standardized metrics across international circuits supports ongoing refinement of these frameworks, particularly as August schedules intensify with overlapping events and variable environmental demands.